Chapter 4: Science and society
This is chapter 4 of the Wellcome Global Monitor 2018
Read all chapters
Summary
- Globally, about seven in ten people worldwide feel that science benefits them, but there is a wide variation across regions. However, only around four in ten people believe that science benefits most people in their country.
- Around a third of people in North Africa, Southern Africa, Central and South America feel personally excluded from the benefits of science.
- The region of the world where 'Sceptics' (people who do not believe that science benefits them personally nor society as a whole, see Chart 4.5) are most common is South America, where they represent almost a quarter of the population of the overall region.
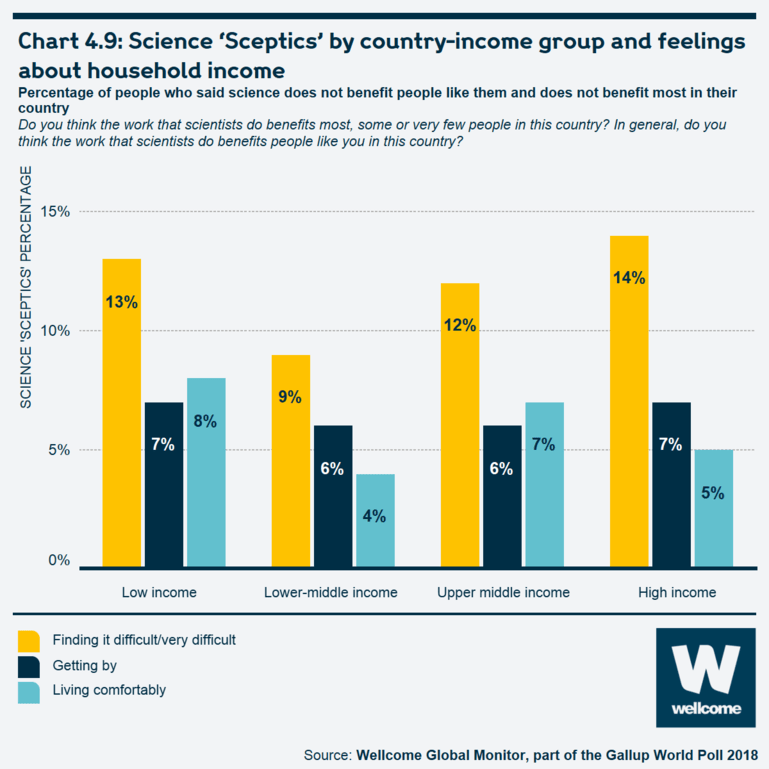
- In high-income countries, people who say they are 'finding it difficult' to get by on their present income are about three times as likely as people who say they are living comfortably to be sceptical about whether science benefits them personally or benefits society as a whole.
- Overall, out of more than 140 countries in this study, people in France are most likely to see science and technology as a threat to the local employment prospects. Regionally, the people of Western and Eastern Europe are the most pessimistic regions about the impact of science and technology on jobs in their countries.
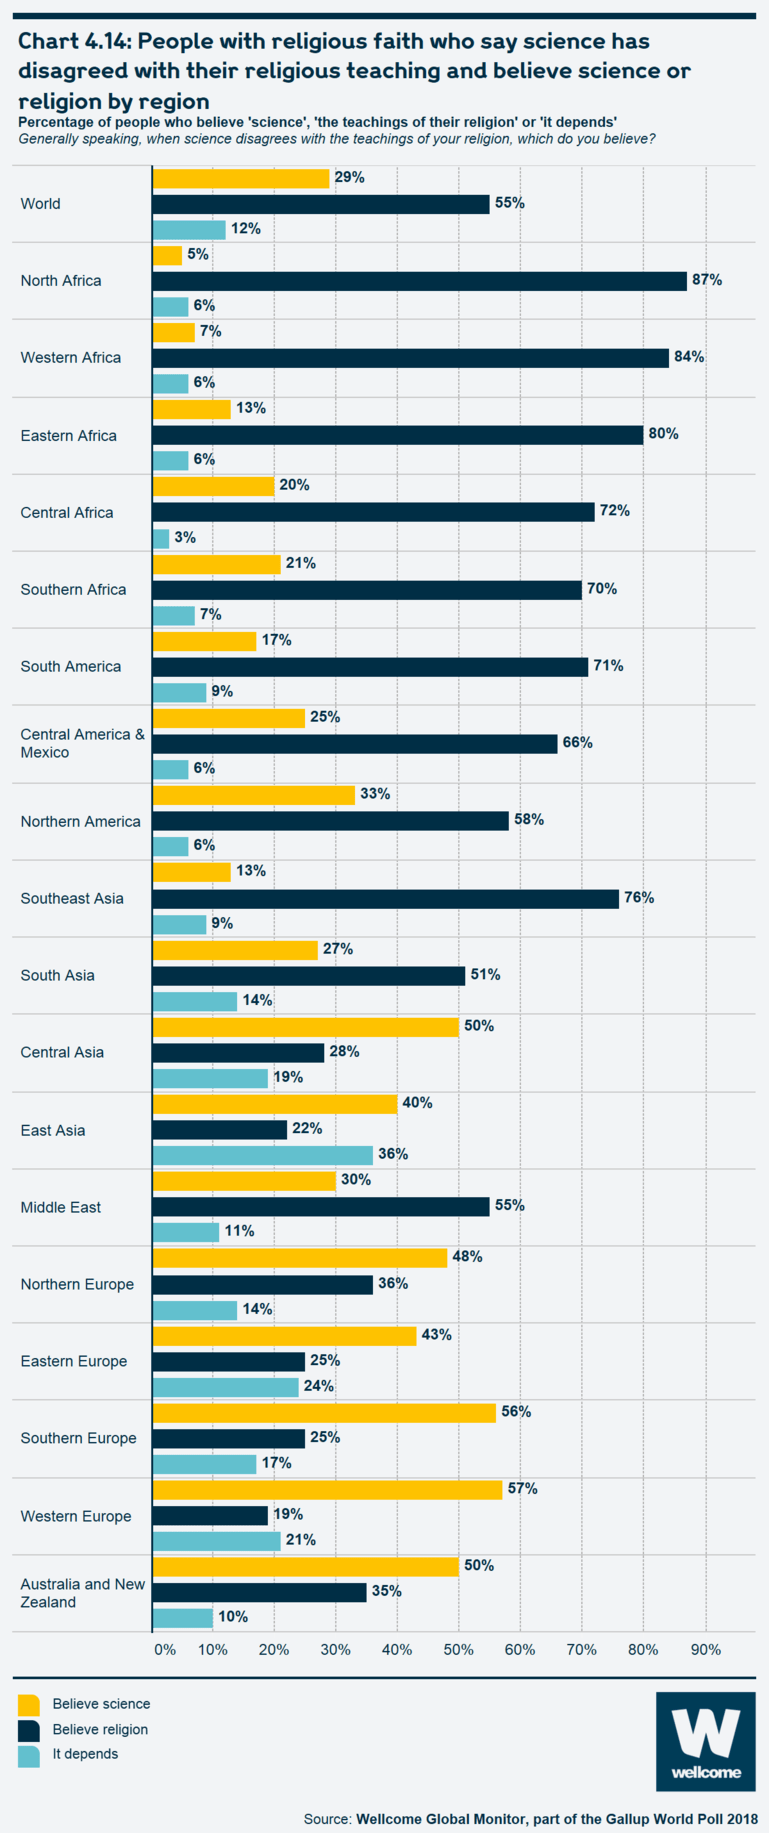
- Among people with a religious affiliation, 55% would agree with their religious teachings in a disagreement between science and their religion; 29% would agree with science and 13% say it depends on the issue.
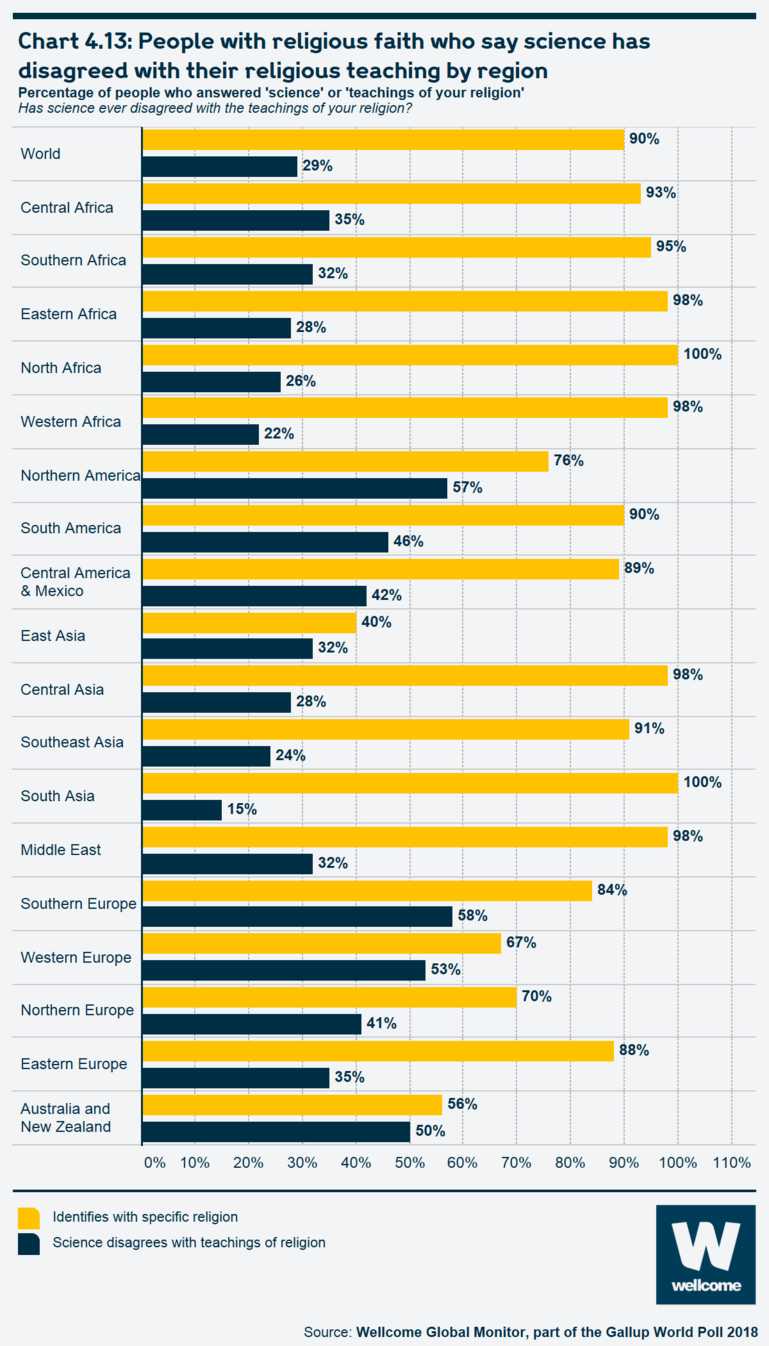
- Among people who say they have a religion, the highest percentages of people who say that science has disagreed with their religious teachings are in the US and Southern Europe.
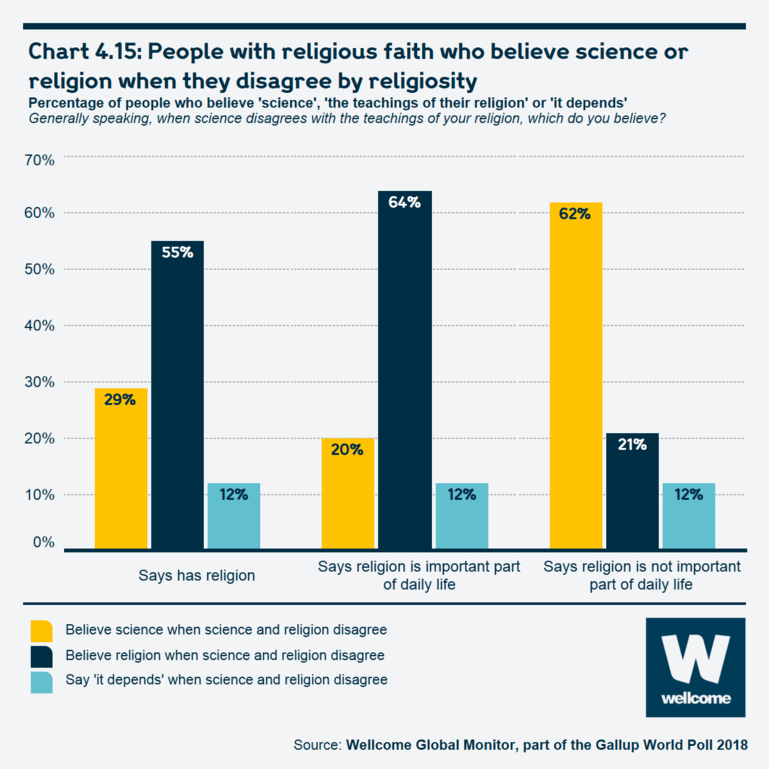
- Globally, 64% percent of people who have a religious affiliation and who say religion is an important part of their daily life, say that when there is a disagreement, they believe religion over science.
In this chapter:
- Introduction
- Do people feel that science benefits them?
- Do people feel that science benefits other people in their country?
- The combined view: how people feel about the benefits of science on a personal and societal level
- Do people believe that science will improve life for the next generation?
- Do people think science and technology will increase or decrease the number of jobs in their local area in the next five years?
- The relationship between religion and science in people’s lives
Box 4.1: Research topics addressed in this chapter
- How included do people feel in science and health research, and to what extent do people believe science benefits them personally as well as society as a whole?
- Are people concerned about the impact of science and technology on their economic well-being and employment opportunities, and do people believe that science and technology will benefit the next generation?
- For people for whom religion is an important part of their daily lives, to what extent do they believe that science and the teachings of their religion disagree, and in the case of disagreement, which information do they believe?
Survey questions discussed
- In general, do you think the work that scientists do benefits most, some, or very few people in this country?
- In general, do you think the work that scientists do benefits people like you in this country?
- Overall, do you think that science and technology will increase or decrease the number of jobs in your local area in the next five years?
- Overall, do you think that science and technology will help improve life for the next generation?
- Has science ever disagreed with the teachings of your religion?
- Generally speaking, when science disagrees with the teachings of your religion, which do you believe?
Introduction
The argument that science is a public good (rather than science is good for the public) has been much discussed in recent decades.1,2,3 The concept of the public good was first coined by economists,4 who define it as essentially having two distinct characteristics: firstly, it is a good that is freely available to all people (non-excludable), and secondly, it is a good that is not reduced by use, meaning that use by one person does not reduce its availability to others. The assertion that science is a public good is mainly due to the fact that it is defined as knowledge.5
However, the beneficial results from science and scientific knowledge are not always perceived to be available to all: some people do not consider themselves included in the benefits of science. Given the importance of inclusivity in science, this idea – whether everyone feels like they actually benefit from science – is one of the important research questions the Wellcome Global Monitor explores at an unprecedented global level. The findings from this section of the study are discussed in this chapter.6,7,8
Do people feel that science benefits them?
Seven in ten people worldwide feel that science benefits them, but this is not uniformly the case across all regions
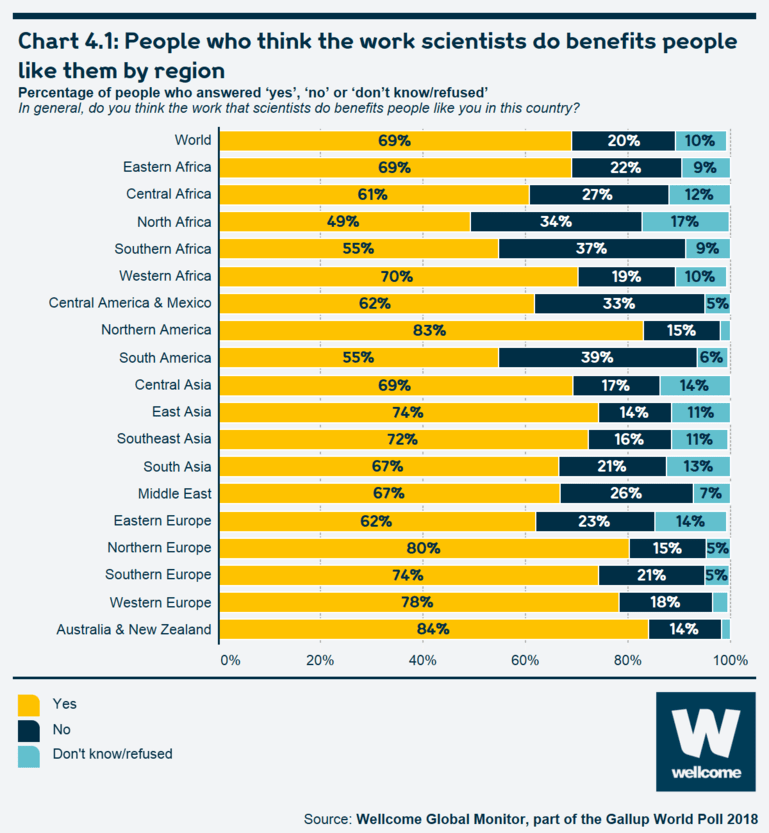
One condition of continued public engagement with support for science and health-related research is that work in those fields should result in clear outcomes that improve people’s lives.9 Globally, 70% of people say the work that scientists do benefits 'people like them', while 20% feel personally excluded from the benefits of science – that is, they said they do not believe the work of scientists benefits people like them. These perceptions vary considerably by region, as is shown in Chart 4.1. These findings are consistent with past research10 on this topic, although that is much more limited in country coverage.
Pressing play on the video above will set a third-party cookie. Please read our cookie policy for more information.
Chart 4.1: People who think the work scientists do benefits people like them by region
See the interactive version of this chart.
One in three people in North Africa, Southern Africa, Central and South America feels personally excluded from the benefits of science
About a third of people in each of North Africa, Southern Africa, Central and South America do not believe the work that scientists do benefits people like them. The regions that are most likely to feel personally excluded from science also tend to be the most negative about the state of their local economy,11 underscoring the link that many people make between science and economic growth.12 Initial research indicates that there are a range of factors such as income, education and demographic groups that relate to the feelings people have of inclusion or exclusion from the benefits of science. However, these factors only account partly for the findings, and there are other country-specific considerations that may contribute to those sentiments of being included or excluded from the benefits of science, such as whether people feel that science is something that is shaped by their national culture or history rather than something that is 'foreign' to their culture.
For instance, it is increasingly reported13,14,15 that the communication of science needs to be more socially and culturally aware, for it not to be considered exclusive and 'Western' driven.16 In Africa, for example, science journalists Sarah Wild and Linda Nordling note that 'the way science is taught and practised in Africa is not socially inclusive. It mostly ignores African perspectives on science and contributions to the field'.
As we will see throughout this chapter, South and Central America are the regions of the world that tend to be most sceptical about how inclusive the benefits of science are – whether the benefits of science can be felt by people like themselves or by most people in their country. This may be partly due to the way society and governments view science in general, and the region’s extreme social and economic disparities may also be a contributing factor. There also appears to be a generally low priority and lack of resources devoted to science and scientific research in many countries across the continent, which means that government funding of scientific research is limited, and 'private industries in Latin America are in general reluctant to invest in scientific development'.17 In addition, other research has found that there is a basic tension between religion and science across Latin America – a finding that is also echoed by the results on this topic discussed later in this chapter.18
At least 80% of people living in Northern America, Northern Europe and Australia and New Zealand feel included in the benefits of science
At the other end of the spectrum, at least eight out of ten people living in Northern America, Northern Europe and Australia and New Zealand feel included in the benefits of science. These findings echo other research in those regions, which also suggests that while there is broad support and belief in the benefits of science more generally, that is not always the case with regards to specific issues, such as genetically modified food or fracking, for example.19,20,21,22
People in Saudi Arabia, Denmark and Iceland are most likely to say the work of scientists benefits people like them
In 115 out of over 140 countries included in this first wave of the Wellcome Global Monitor, a majority of people (over 50%) said the work scientists do benefits people like them.23 However, it is notable that in some countries those proportions are close to 90% of people: Saudi Arabia, Denmark and Iceland have the most positive outlook regarding the benefits of science to them, with nearly nine in ten people saying the work that scientists do benefits people like them.
Table 4.1: Countries where people are more likely to say the work of scientists benefits people like them
Percentage of people who answered 'yes'
In general, do you think the work that scientists do benefits people like you in this country?
| Country | % 'Yes' |
|---|---|
| Saudi Arabia | 89% |
| Denmark | 88% |
| Iceland | 88% |
| Australia | 85% |
| Canada | 85% |
| Germany | 85% |
| Bangladesh | 84% |
| Finland | 83% |
| USA | 83% |
| Uzbekistan | 83% |
| UK | 82% |
| Median result for all 144 countries | 64% |
Saudi Arabia’s position at the top of the table is notable. While the country has historically had a modestly sized scientific research sector as measured by GERD,24 national leaders in Saudi Arabia have recently sought to build the country’s scientific capacities through investment in universities and other research and development centres,25 and this has already seen a rise in science-related literature published in the country.26 Moreover, learning science at school is a very common experience in Saudi Arabia, with 84% of people saying they studied science at a secondary school or post-secondary education level. In addition, as noted in a 2016 OECD report, 'Saudi Arabia has one of the highest shares of students graduating in science fields across OECD and partner countries.'27
Other countries where a large share of people believe science benefits them personally include Germany (85%), Canada (85%), Australia (85%), the US (83%), Finland (83%) and the UK (82%). Two countries on the list in Table 4.1 stand out from this group of high-income countries: Bangladesh, where 84% of people said science benefits them personally, and Uzbekistan, with a corresponding figure of 83%.
Box 4.2: 84% of people in Bangladesh believe the work scientists do benefits people like them
Bangladesh, a lower-middle-income country with a limited scientific research sector,28 does not seem to fit the profile of other countries that are highly positive about the benefits of science to them personally. However, recent changes in the country – including a government initiative to increase Bangladeshis’ access to the internet – may help explain these results.29 According to the International Telecommunications Union (ITU), internet penetration rates grew from around 4% in 2010, to 14% in 2016, to around 20% in 2018.
In addition, Bangladesh has been experiencing relatively strong economic growth: between 2008 and 2016, the economy grew, on average, by more than 6% a year according to World Bank data; in 2017 and 2018, growth was closer to 8% according to the International Monetary Fund.30
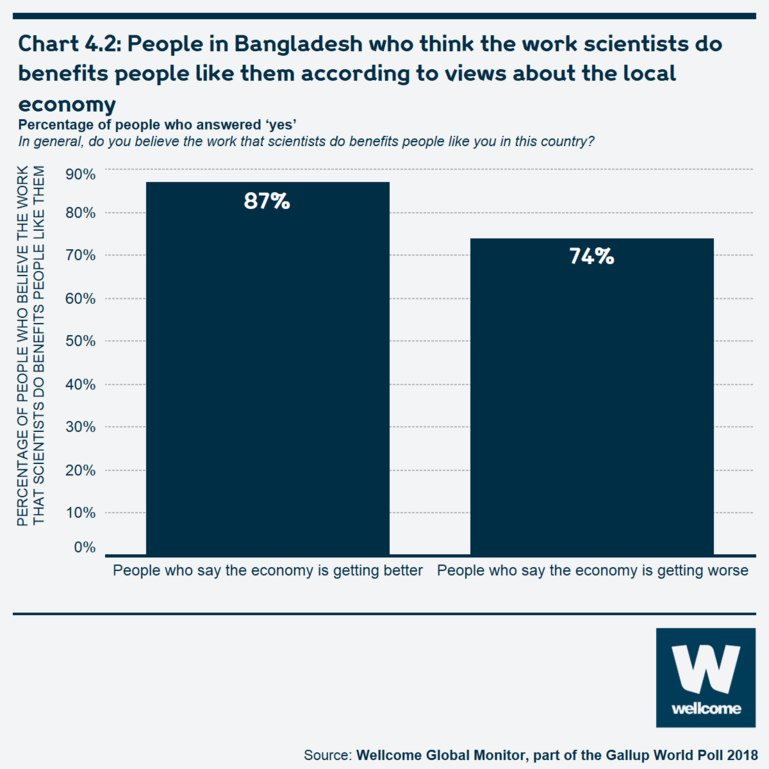
Importantly, many people in the country can feel this economic growth, with the percentage of people in Bangladesh who say their local economy is getting better rising from 55% in 2008 to 79% in 2018, according to the Gallup World Poll. This may make a difference in whether people believe the benefits of science are inclusive on a personal level – 87% of people in Bangladesh who said the local economy was getting better also said that the work that scientists do benefits people like them, compared to 74% of people in Bangladesh who believe the local economy is getting worse. However, those findings are preliminary and further research is needed.
Chart 4.2: People in Bangladesh who think the work scientists do benefits people like them according to views about the local economy
See the interactive version of this chart.
Do people feel that science benefits other people in their country?
In 15 out of 18 regions, less than half say science benefits most people in their country
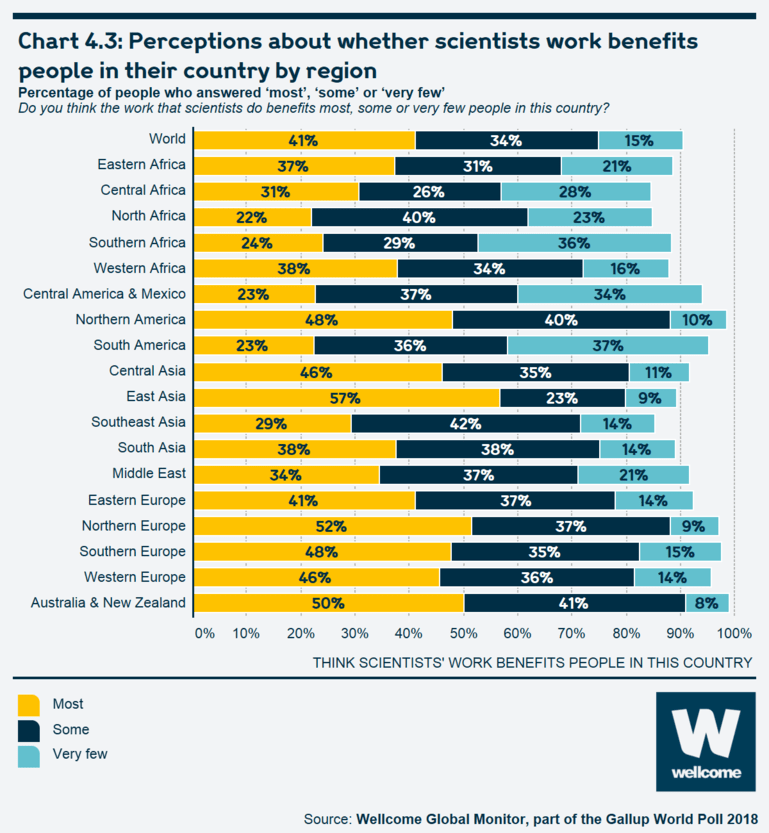
About four in ten people worldwide (41%) say the work that scientists do benefits 'most' people in their country, while 34% say it benefits 'some' and 15% say it benefits 'very few'. Regionally, people in East Asia are most likely to say the work that scientists do benefits 'most' people in their countries (57% of people in this region expressed this opinion), though this largely reflects the fact that 60% of people in China gave this response; this figure is far lower in South Korea at 44%, 35% in Taiwan, 29% in Japan and 17% in Mongolia. Japan’s result is in line with past research that shows the country has lost some confidence in the scientific community following the Fukushima disaster in 2012.31
Chart 4.3: Perceptions about whether scientists' work benefits people in their country by region
See the interactive version of this chart.
In three regions, about a third of people said that science helps 'very few' people in the country: South America (37%), Central America/Mexico (34%), and Southern Africa (36%). These findings signal the relatively low confidence among people in those regions that the benefits of science are available to all of society. This is examined further in the next section, which looks at people’s views about the benefits of science at a combined personal and country-wide level.
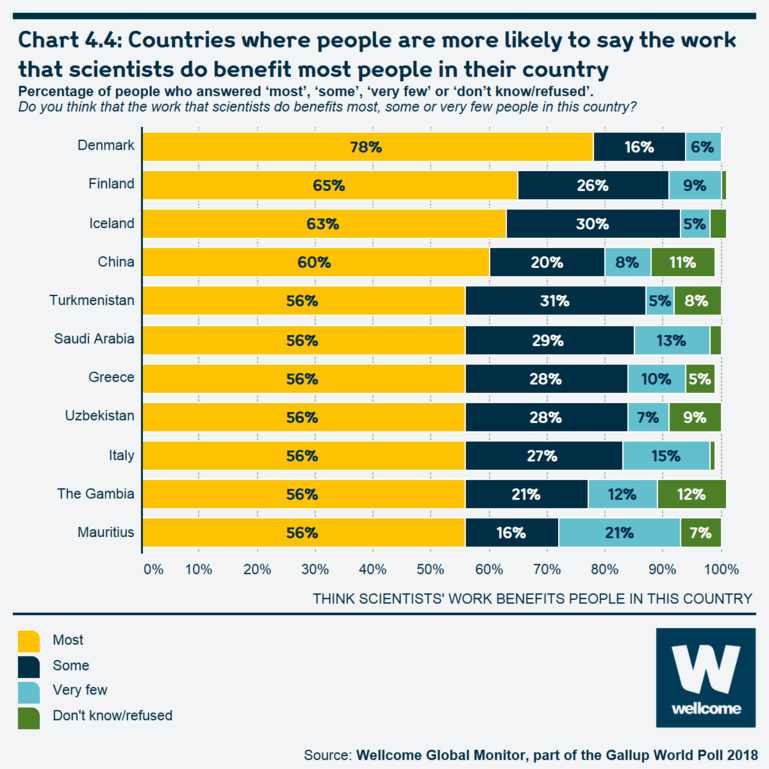
At the country level, people in Denmark are, by a notable margin, the most likely of any country to say that the work that scientists do benefits 'most' people in their country, with 78% of people taking this position. A majority of people in two other Northern European countries also say science helps 'most' people: Finland (65%) and Iceland (63%). Notably, all three countries, relative to their size, have a sizeable scientific research industry,32 though the relationship between a country’s research and development spending as a percentage of gross domestic product, and the percentage of its people who said 'most' is only of moderate strength.33
Chart 4.4: Countries where people are more likely to say the work that scientists do benefits most people in their country
See the interactive version of this chart.
A few other countries on this list also bear further mention:
- 60% of people in China believe the work that scientists do benefits 'most' people in their country. This suggests the Chinese government’s decades-long policies to support the country’s scientific research capabilities enjoys public support,34 at least in principle.
- In Greece, 56% of people say science benefits 'most' people in the country. Other research has found Greeks are very positive about science. For instance, a 2001 Eurobarometer poll found that people in Greece are the most likely of any European Union country to agree that science and technology 'can solve all problems'.35
- In The Gambia, the high percentage of people who believe the work that scientists do benefits most people in their country seems out of step with the country’s limited spending on research and development or the number of researchers in the country36 – indicators that help measure the prominence of science in a society. However, since 2007, the country has had a specific government ministry dedicated to, among other things, promoting scientific research and access to general education.37 The fieldwork in The Gambia overlapped with the country’s first national science week, potentially influencing sentiment towards science at that time.
- In Mauritius, 56% of people said science benefits most people in the country; the survey fielding period overlapped with the government launching National Science Week, which may have made public opinion in that country more positive on this question, as well as others in the survey.38
The combined view: how people feel about the benefits of science on a personal and societal level
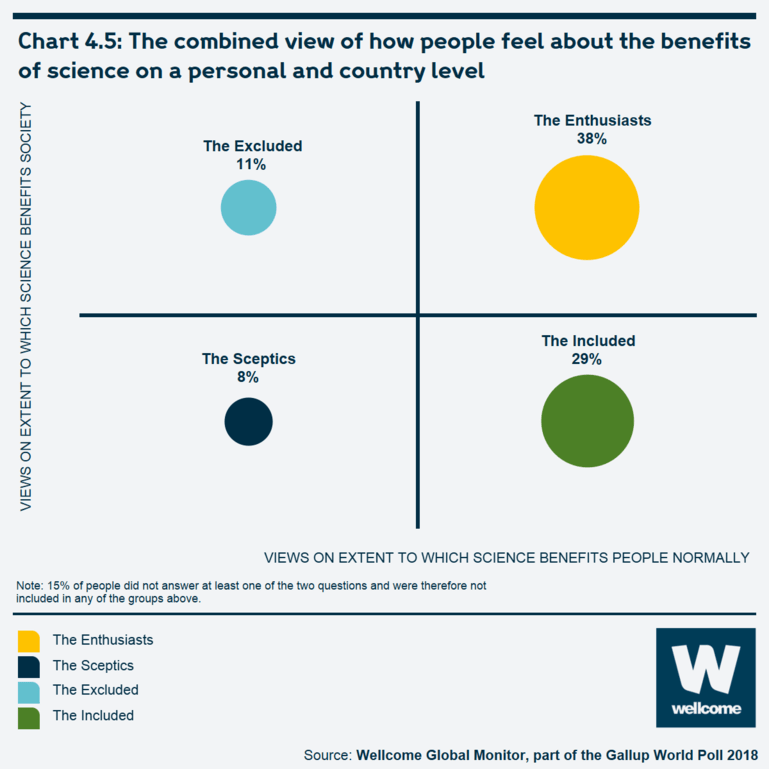
The previous two questions provided insights into how inclusive a person feels the benefits of science are at the personal level and the societal level separately. In an effort to gain an insight into how people feel about the benefits of science for both themselves and society as a whole, a summary measure was constructed combining each person’s responses to both questions together. Four groups of people were identified through this analysis: the 'Enthusiasts', the ‘Included’, the 'Excluded' and the 'Sceptics' (see Box 4.3).39 People who said 'don’t know' to either of the two questions were placed into a separate category.
Box 4.3: A combined indicator of how people feel about the benefits of science
Past research has found that people associate science with progress of some kind – be it economic, technological or as improving the overall quality of life.
Using the two Wellcome Global Monitor questions on the benefits of science to people personally and to society overall, we combined people’s responses to those two questions to construct a measure of how broadly people view the benefits of science:
- In general, do you think the work that scientists do benefits most, some, or very few people in this country?
- In general, do you think the work that scientists do benefits people like you in this country? (Yes/No/Don’t know/Refused)
People were assigned to the following groups based on their responses to both questions:
- The Enthusiasts: people who said science benefits people like them and most people in the country
- The Included: people who said science benefits them personally but not most people in society
- The Excluded: people who said science does not benefit them personally but benefits some or most in society
- The Sceptics: people who said science does not benefit them personally nor does it benefit most in society.
Chart 4.5: The combined view of how people feel about the benefits of science on a personal and country level
See the interactive version of this chart.
Almost four in ten people worldwide (38%) fall into the 'Enthusiasts' group, meaning they believe the benefits of science are felt by most people in society, as well as by them personally. A somewhat lower proportion, 29% worldwide, are among the ‘Included’ – those who believe that science benefits them personally but do not think it benefits many others in society. On the other hand, 11% of people can be described as ‘Excluded’, meaning they feel that though most people benefit from science, they themselves do not. And finally, 8% of people worldwide belong to the least positive group: the 'Sceptics'. These are the people who believe science does not benefit them personally nor does it benefit most people in their country. Taken together, that constitutes some 19% of people worldwide – almost one in five – who believe that science does not benefit them personally – i.e. they feel excluded from the benefits of science.
The next few sections will look more closely at the most and least optimistic groups with regard to the benefits of science – the Enthusiasts and the Sceptics – in an effort to identify the regions and demographic characteristics that these groups belong to, and what factors might be associated with their opinions and perceptions of how inclusive the benefits of science are.
A closer look at the 'Enthusiasts': they tend to be wealthier and more educated
Enthusiasts tend to be the largest of the four groups in most countries. They are most numerous in Denmark, where they represent almost three-quarters of the population. Other countries with high 'Enthusiast' percentages include Iceland, Finland, Saudi Arabia and China.40
Table 4.2: Countries where people are most likely to be science 'Enthusiasts'
Percentage of people who said science benefits people like them and most people in the country.
Do you think the work that scientists do benefits most, some or very few people in this country? In general, do you think the work that scientists do benefits people like you in this country?
| Country | % Enthusiasts |
|---|---|
| Denmark | 75% |
| Iceland | 61% |
| Finland | 61% |
| Saudi Arabia | 55% |
| China, Greece, Uzbekistan | 54% |
Enthusiasts are most common in high-income countries (41%) as well as upper-middle-income countries (42%). Fewer people in lower-middle-income countries or low-income countries are Enthusiasts, at 32% and 31% respectively.
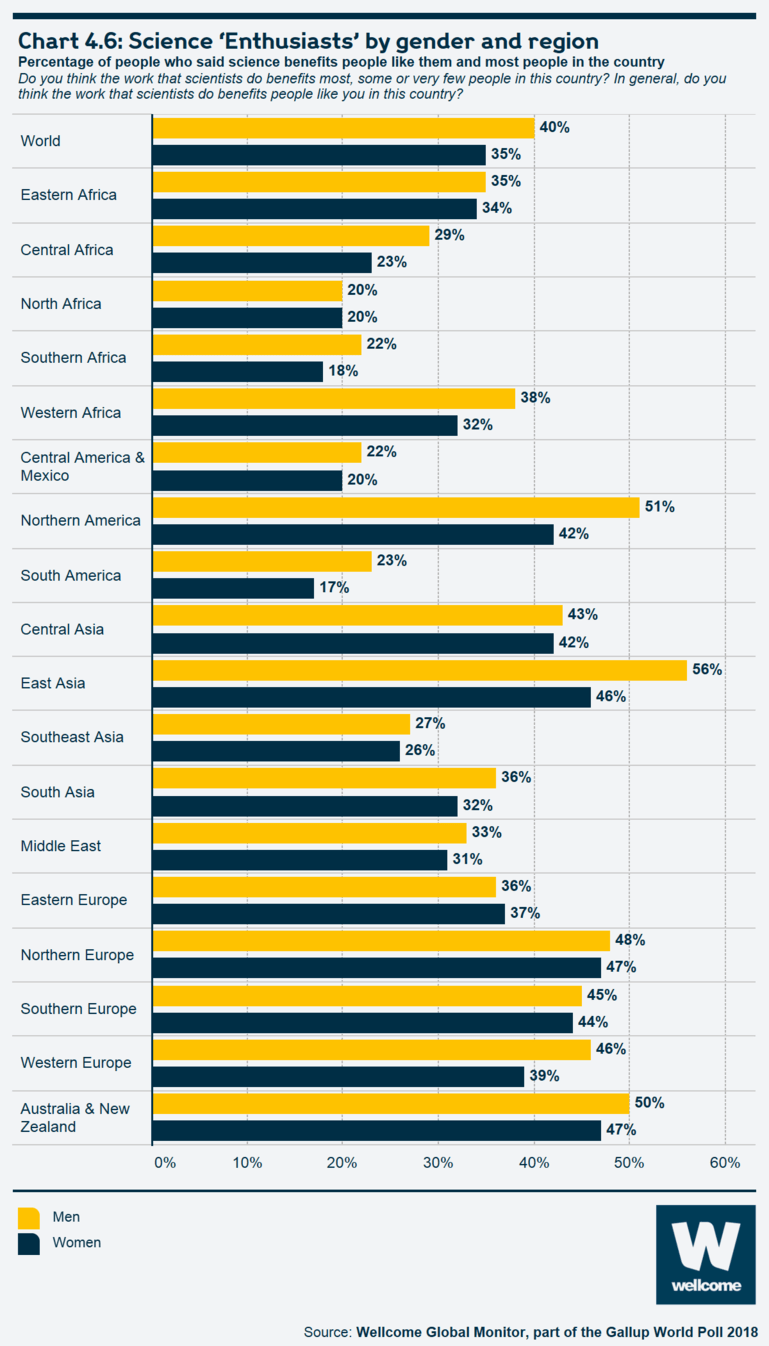
In terms of individual characteristics, people who come from a higher socio-economic background, such as higher household income or completing a college or university-level education, are more likely than others to be Enthusiasts. Gender also plays a role – but only in some areas of the world, such as Northern America or East Asia (see Chart 4.6). However, in about half of the regions, the differences between women and men are statistically negligible.
Chart 4.6: Science 'Enthusiasts' by gender and region
See the interactive version of this chart.
In addition, on a global level, people who say religion is important in their daily lives are, on balance, less likely to be considered Enthusiasts about the benefits of science than people who say religion is not important in their daily life, at 34% to 45% respectively.
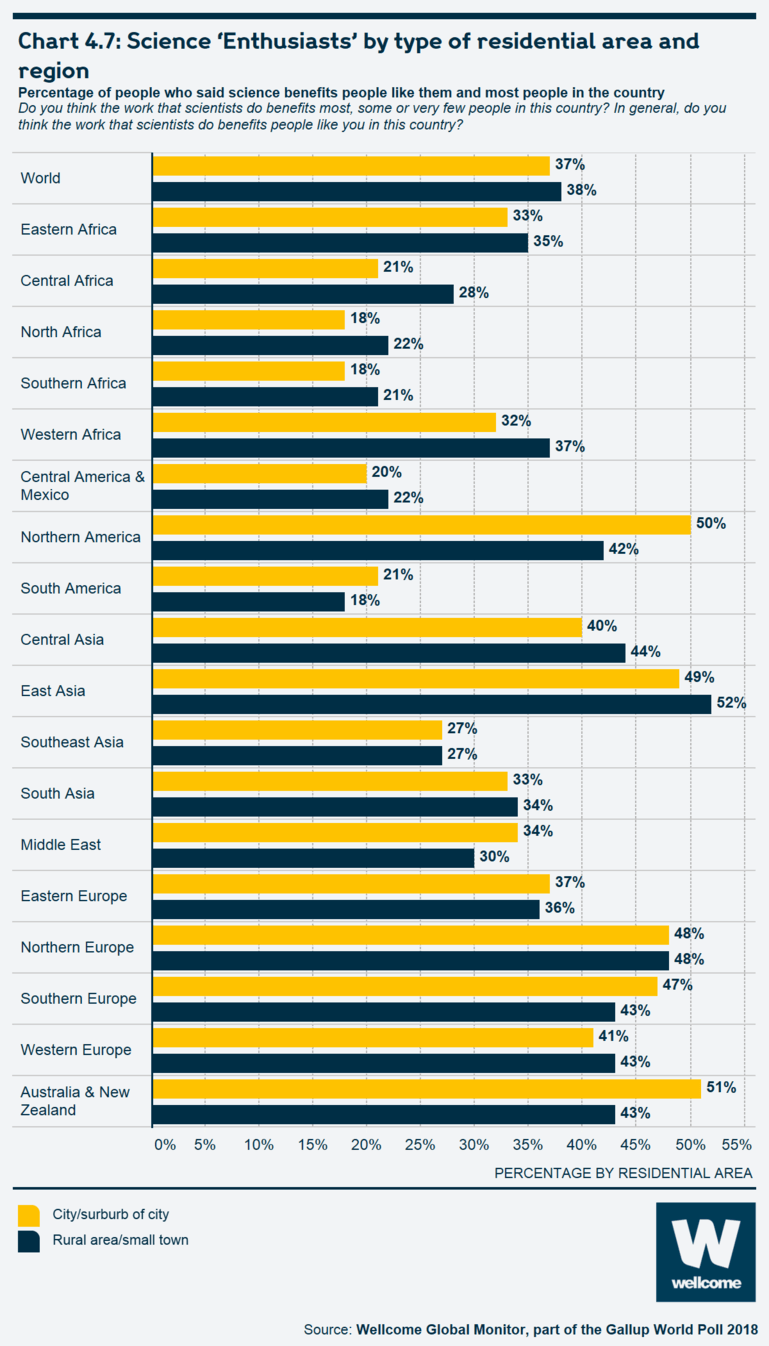
Globally, people living in urban areas (cities or suburbs of cities) are no more likely to be Enthusiasts than people living in non-urban areas (rural areas or small towns), at 37% to 38% respectively. Yet, in some regions of the world, such as Western or Central Africa, people living in non-urban areas are slightly more likely to be Enthusiasts than those living in the urban areas. In Northern America and Australia and New Zealand, this pattern is reversed.
Chart 4.7: Science 'Enthusiasts' by type of residential area and region
See the interactive version of this chart.
People most confident in their knowledge of science are likely to be 'Enthusiasts'
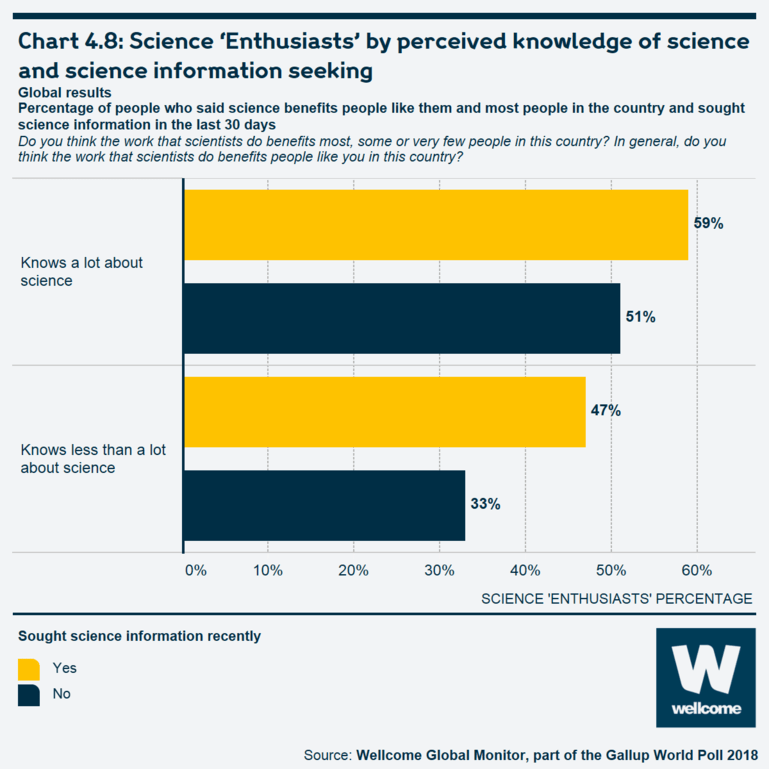
Nearly six in ten people worldwide, who said they know 'a lot' about science, or 56%, are Enthusiasts, suggesting that an overall greater 'comfort' or familiarity with the subject could be an important part of how a person perceives its benefits. This does not mean a person needs to feel they are an expert with science to be convinced of its benefits; recently accessing science information is also associated with a higher likelihood of being an Enthusiast, even for individuals who did not say they know 'a lot' about science.
Chart 4.8: Science 'Enthusiasts' by perceived knowledge of science and science information seeking
See the interactive version of this chart.
In high-income countries, people who say they are 'finding it difficult' to live on present income are almost three times as likely to be 'sceptics' as those who are living comfortably
Worldwide, people who find it difficult or very difficult to get by on their household income are slightly more likely to be 'Sceptics' in terms of their views on the benefits of science (11% of whom are Sceptics), compared to those who are 'getting by' (6% of whom are Sceptics) and those who are 'living comfortably' on present income (5% of whom are Sceptics).
However, in countries designated as high income by the World Bank, people who are finding it difficult or very difficult to get by on their present income are nearly three times as likely to be Sceptics as people who are 'living comfortably' (14% compared to 5% respectively). In addition, in this group of countries, people whose household income falls in the lowest 20% of the national income distribution are more likely than other income groups to feel excluded from the benefits of science.
Chart 4.9: Science 'Sceptics' by country-income group and feelings about household income
See the interactive version of this chart.
'Sceptics' as a group are most prevalent in South America
Though the smallest of the four groups, the Sceptics – people who believe science does not benefit them personally nor most of society – are the most common of the four groups in six countries: Albania, Mongolia, Montenegro, Paraguay, Armenia and Georgia.
However, on a regional basis, the disconnect between society and the benefits of science is especially prevalent in Central and South America; in 12 out of the 19 countries in those regions, at least one in five people, or 20%, are classified as 'Sceptics'. Notably, this attitude is almost as common in each of these countries, despite their different levels of country-income levels.
Table 4.3: Science 'Sceptics' in South and Central America by country
Percentage of people who said science does not benefit people like them and does not benefit most people in society.
Do you think the work that scientists do benefits most, some or very few people in this country? In general, do you think the work that scientists do benefits people like you in this country?
| Country | Sceptics % | Country-income level |
|---|---|---|
| Ecuador | 32% | Upper middle |
| El Salvador | 28% | Lower middle |
| Honduras | 28% | Lower middle |
| Peru | 28% | Upper middle |
| Paraguay | 26% | Upper middle |
| Bolivia | 25% | Lower middle |
| Chile | 24% | High income |
| Panama | 24% | High income |
| Brazil | 23% | Upper middle |
| Guatemala | 23% | Upper middle |
| Colombia | 22% | Upper middle |
| Venezuela | 20% | Upper middle |
| Costa Rica | 19% | Upper middle |
| Nicaragua | 19% | Lower middle |
| Argentina | 18% | High income |
| Uruguay | 18% | High income |
| Dominican Republic | 17% | Upper middle |
| Mexico | 17% | Upper middle |
| Haiti | 15% | Low income |
| Rest of the world | 7% | N/A |
These countries also rate confidence in their national institutions lower than other regions of the world,41 an attitude that, as was seen in Chapter 3, is significant in affecting trust in scientists. Similarly, being a Sceptic is in some way shaped by confidence in institutions, as seen by the strong negative relationship between how many people in a country are strong sceptics and the country’s overall confidence in their institutions.42
Sceptics lack confidence in their country’s hospitals and health clinics
People’s attitudes to science may be related to tangible results in their daily lives. For instance, people who said they do not have confidence in the hospitals or health clinics in their country are about three times more likely to be strong sceptics than people who have confidence in these health institutions, with 17% of the latter group and 6% of the former group considered strong sceptics. This general pattern holds across the different country-income levels.
Table 4.4: Science 'Sceptics' by confidence in hospitals and health clinics and country-income level
Percentage of people who said science does not benefit people like them and does not benefit most people in society.
Do you think the work that scientists do benefits most, some or very few people in this country?
In general, do you think the work that scientists do benefits people like you in this country?
In (country name), do you have confidence in hospitals and health clinics?
| Has confidence in hospitals | Do not have confidence in hospitals % | |
|---|---|---|
| World | 6% | 17% |
| Low-income countries | 8% | 19% |
| Lower-middle-income countries | 6% | 14% |
| Upper-middle-income countries | 6% | 18% |
| High-income countries | 6% | 16% |
Do people believe that science will improve life for the next generation?
More than eight in ten people worldwide believe science will improve life for the next generation
More than eight in ten people around the world – 83% – believe science and technology will help improve life for the next generation. Despite some regional variation, a majority of every region is optimistic about what science and technology can do for the next generation, from a high of 91% in Northern America to the lowest regional result of 71% in North Africa.
Do people think science and technology will increase or decrease the number of jobs in their local area in the next five years?
Western and Eastern Europe are the most pessimistic regions about the impact of science and technology on local jobs
Science and technology, whatever benefits they may bring to people, can also prove economically disruptive. In the first Industrial Revolution, for instance, handloom cotton weavers found their skills displaced by new machinery.43 Today, during the ‘Fourth Industrial Revolution’,44 automation is believed by some people to threaten the survival of many occupations, and the livelihoods of many high- and low-skilled workers.45
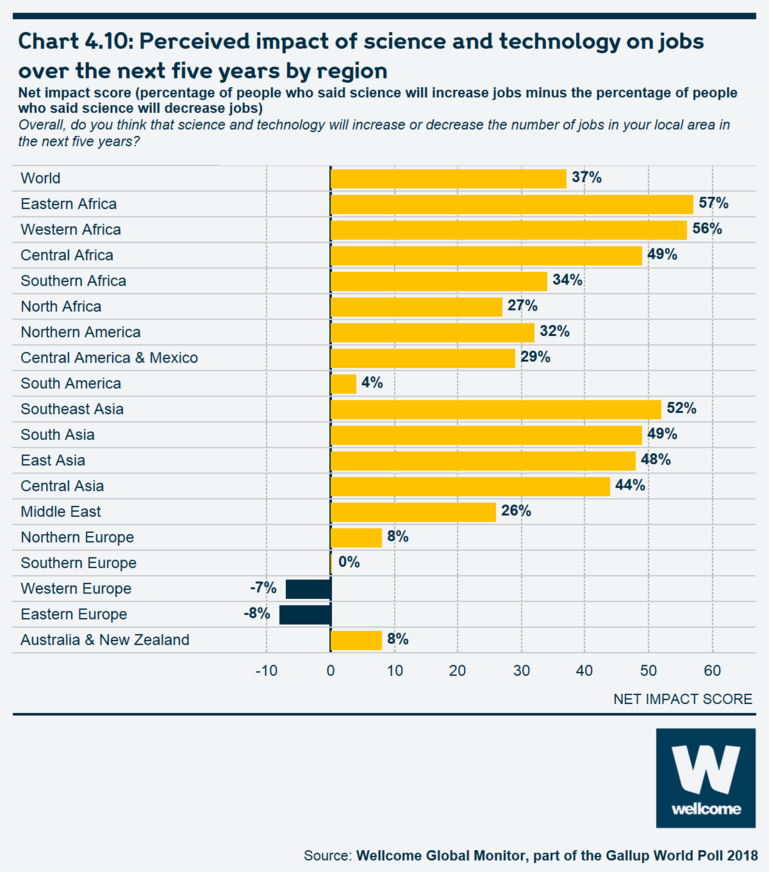
The Wellcome Global Monitor found that people worldwide are almost three times as likely to say science and technology will increase (58%) rather than decrease (21%) the number of jobs in the local economy. The difference between these two figures can be described as the ‘perceived net impact’ of science on local jobs.
In most global regions – especially those in Africa – people are considerably more likely to believe science and technology will increase rather than decrease jobs. Western and Southern Africans are the most optimistic, though it should be noted that a fifth of people in all the African regions said they 'don’t know' how science will impact local job markets. People in most parts of Asia are also very optimistic, most notably in Southeast Asia, with a perceived net impact of +52 points.
The least optimistic tend to be people in high-income regions, especially Western and Eastern Europe. Among regions that contain mostly high-income countries, Northern America is an outlier. People in the United States and Canada are more likely to say science and technology will increase (61% and 53%, respectively) rather than decrease (28% and 33%) jobs in their local area.
Box 4.4: The perceived impact of science and technology on jobs
The Wellcome Global Monitor asks: Overall, do you think science and technology will increase or decrease the number of jobs in your local area in the next five years?
Though two answer options are explicitly offered (increase or decrease), 7% of people worldwide said science and technology would have no effect on jobs, which was accepted as a valid response. Another 14% said they did not know.
To assess if people in a country are either more optimistic or more pessimistic about the impact science and technology will have on jobs, this section will refer to the 'perceived net impact'. This is the percentage of people who said science will increase jobs minus the percentage of people who said science will decrease jobs. A positive net impact score means people are more optimistic than pessimistic about job prospects in relation to science and technology, and a negative score indicates the opposite. Note, people who did not offer an opinion or volunteered the response 'the same' were not included in calculating the 'net jobs'.
Chart 4.10: Perceived impact of science and technology on jobs over the next five years by region
See the interactive version of this chart.
Many European countries are among those most pessimistic about the impact of science and technology on jobs
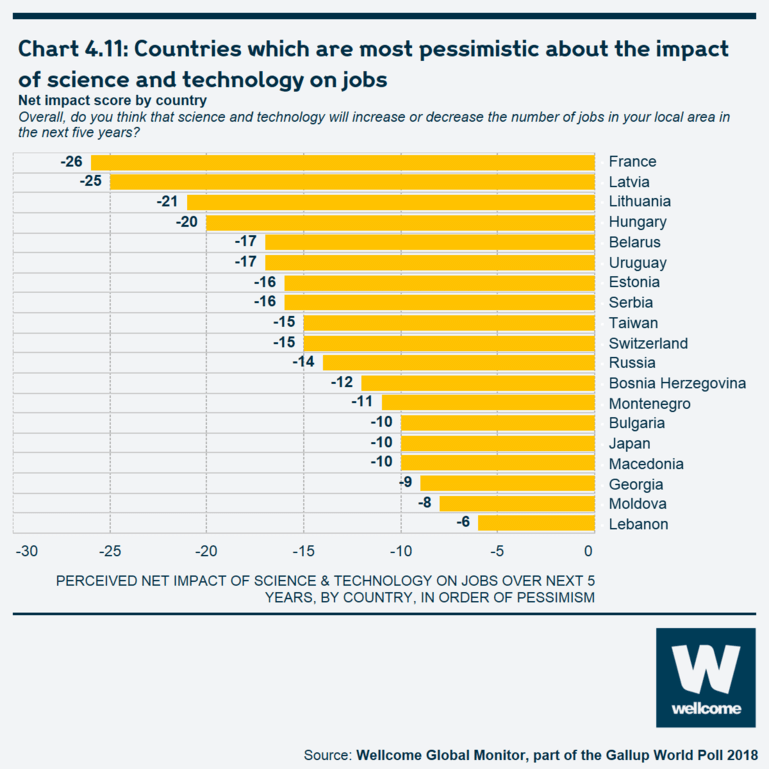
Nineteen out of more than 140 countries in the study are notably more pessimistic than optimistic regarding the impact of science and technology on jobs, 17 of which are in Europe. France is the most pessimistic country in this regard, with 55% of the French saying science and technology will decrease the number of jobs over the next five years, compared to 29% who believe science and technology will increase the number of jobs, for a perceived net impact score of -26.
Three other European countries have a perceived net impact score nearly as negative as France: Latvia (-25), Lithuania (-21) and Hungary (-20). As a whole, about as many people living in the European Union believe science and technology will decrease jobs as increase jobs. In the non-EU part of Europe, views tilt slightly to the negative, with 37% saying science will increase jobs and 42% saying the opposite.
These findings merit more in-depth research, especially given the prevalence of this sentiment in both Western and Eastern Europe as a whole.
Outside of Europe, the most sceptical societies concerning the effect of science and technology on local jobs are in Uruguay (-17 points), Taiwan (-15 points), and Japan (-10 points).
Box 4.5: Pessimistic views on the impact of science and technology on jobs in France
Of the 144 countries included in the Wellcome Global Monitor, France is the only country where more than half of the population (55%) say they think science and technology will decrease the number of jobs in their area over the next five years.
Although much more research is needed to understand why this might be the case, the sluggish performance of the French economy over the last few years may be one factor that contributes to this sentiment. In 2018, for instance, only 23% of French people said now was a good time to find a job, when asked about that in the Gallup World Poll (for the European Union as a whole, this figure was 42%). In addition, six in ten French people think the economy in their local city or area is getting worse. France’s unemployment rate has remained relatively high at around 9%, compared to that in other European economies. Last year, 60% of people in France said the economy of their local city or area was 'getting worse' compared to 25% who said this worldwide.
Other research has found the French particularly worried about the impact of science. A June 2015 European Commission study46 found that people in France, particularly older individuals, were more likely than in other European countries to think scientific innovation moves too quickly and could lead to unemployment.
However, the Wellcome Global Monitor finds no substantial differences between different age groups in France – indeed 15–34-year-olds are about as likely as those aged 55 and older to think science will decrease jobs, with around 55% of both groups saying so.
Chart 4.11: Countries which are most pessimistic about the impact of science and technology on jobs
See the interactive version of this chart.
Local and personal economic conditions and perceptions of threat to local jobs
Views on the effect science and technology have on the local job market may in some cases be a manifestation of personal economic discontent. Adults who feel it is 'very difficult' (51%) or 'difficult' (57%) to live on their present household income are less likely to say science and technology will increase the number of local jobs than those who are 'getting by' (60%) or 'living comfortably' (63%).
People’s economic anxiety about the future appears to shape views of science and technology as an economic threat or opportunity even more than feelings about their current standard of living. At the global level, 70% of those who told the Gallup World Poll that they believe the economy in their city or area was 'getting better' say science and technology will increase the number of local jobs, compared to 50% of those who believe the local economy is 'getting worse'. Similarly, residents who say their standard of living is 'getting better' are more likely than those who say 'getting worse' to believe science and technology will increase the number of local jobs in the economy (67% and 48% respectively).
The mixed effect of education level on views of science and technology’s impact on local jobs
Education levels may inform the way adults perceive the impact of science and technology on their local economy in at least two ways. Firstly, more educated people are likely more familiar with the generally positive impact science and technology have on society. Secondly, higher education levels provide individuals with greater skill specialisation, and that often helps to insulate them from the short-term disruptive effects of science and technology on lower-skilled jobs.
However, at the global level there is little evidence of a positive relationship between education levels and perceptions of science and technology as an opportunity for the local job market. Some six in ten adults at each education level (58% of those with no more than primary education, 58% of those with secondary education and 59% of those with post-secondary education) say science and technology will increase the number of jobs in the local economy over the next five years. In fact, adults with a post-secondary education (27%) are more likely than those with a secondary (24%) or primary (16%) education to say science and technology will decrease the number of local jobs.
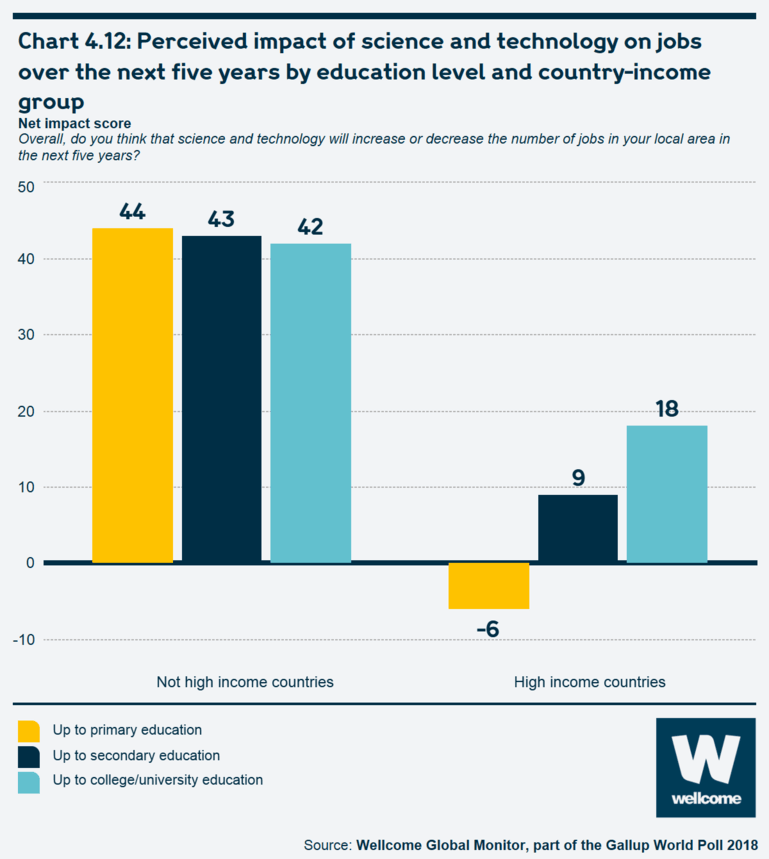
People's opinion of whether science will improve or worsen the local job market can vary, depending on their level of education – but this tends to be true in high-income countries, rather than non-high-income ones. The net difference between those who expect an increase in local jobs compared to those who expect a decrease rises with residents’ education level in high-income countries (-6 points among those with primary education or less, +9 points among those with secondary education, +18 points among those with post-secondary education). In contrast, the net difference in expectations remains high and stable among adults at all education levels in low-, lower-middle-, and upper-middle-income countries (+44 points among those with primary education or less, +43 points among those with secondary education, +42 points among those with post-secondary education).
Despite these countervailing trends, there remains a relatively small net difference between the proportion of job optimists and job pessimists among adults with a post-secondary education – presumably those most insulated from disruptive forces – in high-income countries (+18 points) compared to highly educated residents of countries in all other income groups (+42 points). This suggests the discussion of economic dislocation caused by scientific and technological breakthroughs has led to a relatively broad-based sense of anxiety about possible negative consequences on local job markets.
Chart 4.12: Perceived impact of science and technology on jobs over the next five years by education level and country-income group
See the interactive version of this chart.
The relationship between religion and science in people’s lives
Globally, 61% of people say religion is important in their daily lives
The relationship between science and religious beliefs is regularly debated.47 Scientific principles may sometimes disagree with religious tenets; one of the most long-standing examples is the ongoing opposition by religious groups in the US to teaching evolution but not creationist theories in public schools.48 In every country included in the Gallup World Poll, people are asked to say what their religion is, and whether or not religion is an important part of their daily life. Worldwide in 2018, 90% of people identified with a specific faith, while 8% said they did not, and 2% said they did not know or declined to answer.
Globally, 61% of people say religion is important in their daily lives; this figure has been very stable in the World Poll since 2010. Among the least religious countries is China, where only 18% of people have said that religion is important in their daily lives. In light of these results and the country’s sizeable population, it may be useful to consider China separately when looking at global results for religion-related items. Excluding China from the global results, almost three-quarters of people (73%) say religion is important in their daily lives. The gap between those who say that they have a religion (by birth or otherwise) and those who say that religion is important in their daily lives could be considered as a proxy for the extent of people’s 'religiosity'.
Among people who say they have a religion, the highest percentages of people who say that science has disagreed with their religious teachings are in the US and Southern Europe
Overall, less than three-in-ten people who identify with a religion (29%) say that science has ever disagreed with the teachings of their religion. In general, those regions where people are most likely to say they have a religion tend to be less likely to say that science has disagreed with their religious teachings. For example, in Chart 4.13, the highest rates of religious affiliation (around 95% or higher) are in Africa, South Asia, Central Asia and the Middle East. However, the highest rates of people who said that their religious teachings and science disagreed were reported in Northern America and Southern Europe, where far fewer people report having an affiliation with a particular religion.
Chart 4.13: People with religious faith who say science has disagreed with their religious teaching by region
See the interactive version of this chart.
Those who say science has disagreed with their religion’s teachings are twice as likely to believe their religion than science in such instances
Among people worldwide who say they have a specific religion and that its teachings have disagreed with science, 55% say they generally agree with their religious teachings on such occasions, while 29% believe science and 13% say it depends on the issue.
However, the results vary considerably by region. In Central and East Asia – regions where previous communist regimes had discouraged overt religious expression – as well as Europe and Australia and New Zealand, people tend to believe science over their religious teachings.
Notably, Northern America is the only high-income region in which people who say they have a religion are substantially more likely to say they believe their religion’s teachings over science, in cases of disagreement. This finding is driven predominantly by the US, where people who have a religion are almost twice as likely to believe their religious teachings (60%) as science (32%) in cases of disagreement.
Chart 4.14: People with religious faith who say science has disagreed with their religious teaching and believe science or religion by region
See the interactive version of this chart.
Looking at these regional results by gender and age groups offers more insights about how people think about perceived differences between religion and science. In most regions, men who identify with a specific religion are somewhat more likely than women to say they believe scientific findings when they are different from their religious teachings. This gender difference is widest by far in East Asia (however, given the low number of people who said they have a religion in China, just 5% of East Asians were asked this question, which was a ‘screener’ for asking the rest of the questions in this section). Men who identify with a religion are also substantially more likely than women to believe science when the two disagree in Northern America (39% compared to 28%) and Central America and Mexico (31% compared to 20%).
At the global level, the Wellcome Global Monitor finds that people under the age of 50 who identify with a religion are somewhat less likely than their older counterparts to believe science when it disagrees with their religious teachings – 26% compared to 32%, respectively. However, this pattern varies by region. Younger people in Northern Europe are least likely to say they believe science – though 15–29-year-olds in this region are, relatively speaking, among the least likely people to say they identify with a specific religion. In other regions, including Southern Africa, Southern and Eastern Europe as well as Central America and Mexico, younger people are more inclined than their elders to believe science when it differs from their religious teachings.
Table 4.5: People with religious faith who say science has disagreed with their religious teaching but believe science by region and demographic groups
Percentage of people who believe 'science'.
Generally speaking, when science disagrees with the teachings of your religion, which do you believe?
| Total | Men | Women | Age 15 to 29 | Age 30 to 49 | Age 50+ | |
|---|---|---|---|---|---|---|
| World | 29% | 30% | 27% | 26% | 26% | 32% |
| Eastern Africa | 13% | 14% | 12% | 17% | 10% | 7% |
| Central Africa | 20% | 24% | 16% | 22% | 15% | 26% |
| Northern Africa | 5% | 5% | 4% | 5% | 3% | 6% |
| Southern Africa | 21% | 18% | 25% | 25% | 18% | 18% |
| Western Africa | 7% | 7% | 8% | 8% | 7% | 7% |
| Central America/Mexico | 25% | 31% | 20% | 34% | 20% | 18% |
| Northern America | 33% | 39% | 28% | N/A | 36% | 29% |
| South America | 17% | 19% | 14% | 18% | 15% | 16% |
| Central Asia | 50% | 49% | 50% | 51% | 52% | 42% |
| East Asia | 40% | 54% | 24% | 54% | 36% | 37% |
| Southeast Asia | 13% | 15% | 11% | 11% | 15% | 13% |
| Southern Asia | 27% | 28% | 26% | 29% | 24% | 30% |
| Middle East | 30% | 31% | 29% | 33% | 29% | 27% |
| Eastern Europe | 43% | 46% | 41% | 51% | 43% | 39% |
| Northern Europe | 48% | 52% | 45% | 40% | 55% | 48% |
| Southern Europe | 56% | 60% | 53% | 63% | 60% | 50% |
| Western Europe | 57% | 54% | 60% | 56% | 58% | 57% |
| Australia and NewZealand | 50% | 53% | 48% | N/A* | N/A* | 51% |
*Sample size too small
Likelihood to believe science or religion depends largely on the importance of religion in daily life
Globally, 64% percent of people who have a religion and who say religion is an important part of their daily life, say that when there is a disagreement, they believe religion over science; 62% of those who say religion is not an important part of their daily lives believe science.
This finding is important in relation to the efforts of the scientific community to engage with people across different countries and cultures. Religion plays a vital role in the lives of billions of people around the world, and it can influence how people think about science. Ignoring this, or treating science and religion as completely separate and independent domains, might make it harder to understand and affect the way people feel about scientific issues.
Chart 4.15: People with religious faith who believe science or religion when they disagree by religiosity
See the interactive version of this chart.
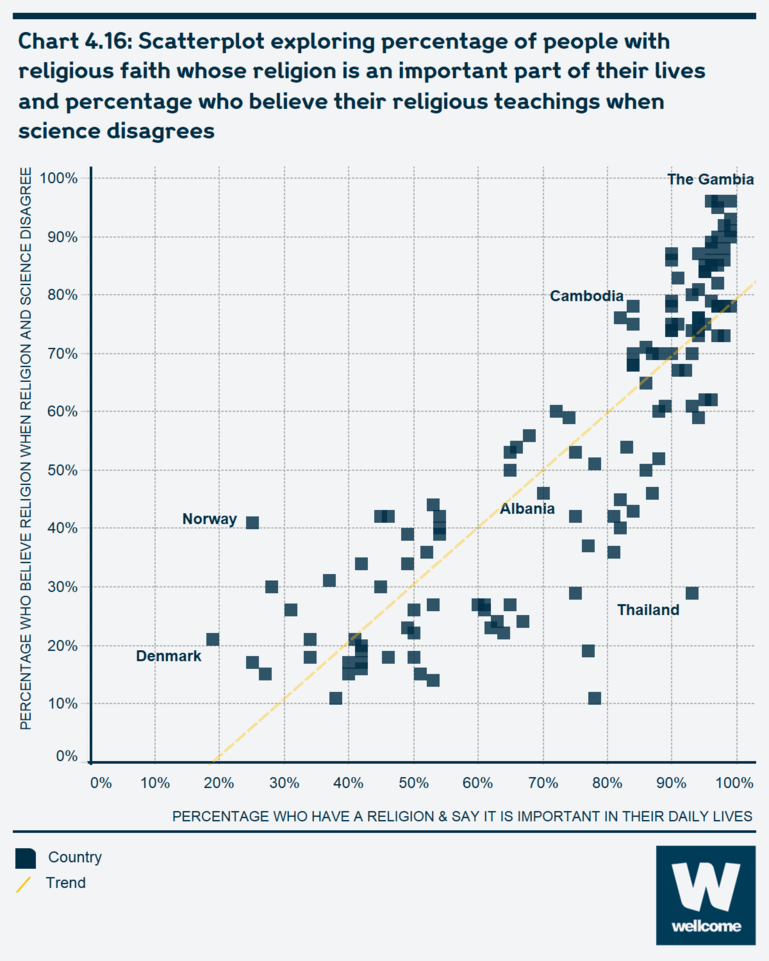
There is also a strong correlation at the country level between a population’s overall level of religiosity (i.e. the percentage of people who say they have a religion and that it plays an important role in their daily life) with the percentage of people who believe religion when science and religion disagree. The countries in the lower left-hand corner of Chart 4.16 – those with low levels of religiosity and where people are less likely to believe religious teachings when they conflict with science – are predominantly in Western, Northern, and Southern Europe as well as East Asia. Countries in the upper right-hand corner are mainly in Central and South America, Africa, and the Middle East.
Chart 4.16: Scatterplot exploring percentage of people with religious faith whose religion is an important part of their lives and percentage who believe their religious teachings when science disagrees
See the interactive version of this chart.
A few countries in Chart 4.16 that seem to be relative outliers are notable. In Thailand, for example, 93% of people say religion is important in their daily lives, but people in Thailand are about as likely to say they would believe science (26%) as their religious teachings (29%) when the two disagree (notably, 38% of people say 'it depends' on the issue).
By contrast, in Norway, just 25% of people say they have a religion that is important in their daily lives, but among those who do identify with a religion, a relatively high 41% say they believe their religious teachings when there is conflict with science.
Conclusion
Science is often described as a public good – it seems obvious to many in the scientific community that their work helps to generate knowledge that the rest of society can use to improve people’s lives. The Wellcome Global Monitor tested whether people outside the scientific community agreed with this view, and asked who they thought science benefits.
Around two fifths of people in the world think science benefits people like them, as well as most people in their country. People with this view tend to be relatively well-off in their country, and they tend to be in countries with a higher national income. However, in high-income countries, people who are struggling financially are three times more likely than those who are comfortable to think science brings no benefits to most people. This view, held by 10% of people worldwide, is particularly prevalent in Central and South America, where, in many countries, at least 20% of people – and as high as 32% in Ecuador – say they see no benefits from science for most people, including themselves.
Most people do think science and technology will improve life for the next generation and increase the number of jobs. An exception is in some high-income regions like Europe, where people tend to be much less optimistic, with many (55% in France, for example) believing science and technology will reduce jobs.
These findings suggest that people largely see science as a public good, but there are certain contexts in which science is seen as a threat to people’s livelihoods. This has to be taken into account when thinking about the relationships between science and society.
Religion and science are sometimes depicted as being in opposition, but Wellcome Global Monitor challenges this stereotype by finding that most people in the world do not see a conflict between their religious beliefs and science. The relationships between religion and science are evidently complex and specific not only to particular religions, but also to different countries and cultures in which people practise their religion. North America and North Africa are good examples; the former has comparatively fewer religious adherents, but of those that do, they are far more likely to see a conflict between religion and science, while the latter has a high proportion of religious people, most of whom do not see such a conflict.
If any interactive charts are slow to load, try later or contact our team at wgm@wellcome.org.
Endnotes
- Callon M. Is Science a Public Good? Fifth Mullins Lecture, Virginia Polytechnic Institute, March 1993. Science, Technology and Human Values 1994;19(4):395–424.
- Thursby M. ‘Is saying 'science is a public good' a wrong assumption?’ Swiss National Centre of Competence in Research. https://nccr-chembio.ch/blog/science-public-good/ [accessed 9 May 2019].
- The Royal Society. Science and the Public Interest. https://royalsociety.org/-/media/Royal_Society_Content/policy/publicatio.... April 2006. [accessed 9 May 2019].
- Countless economists have written about public goods – all economics textbooks discuss the subject. The economist Paul A. Samuelson is often credited as the first economist to develop a theory of public goods in his 1954 work: The Pure Theory of Public Expenditure. Review of Economics and Statistics 1954;36(4):387–9.
- Dalrymple D. Scientific Knowledge as a Global Public Good: Contributions to Innovation and the Economy. In JM Esanu, PF Uhlir (eds). The Role of Scientific and Technical Data and Information in the Public Domain. Washington (DC): National Academies Press (US); 2003, and in The Scientist, June 20, 2005.
- Martinson BC, et al. Scientists behaving Badly. Nature 2005 9 June; 737–8. Also https://files.transtutors.com/cdn/uploadassignments/2663608_1_w5-scienti... [accessed 9 May 2019].
- Rutjens BT, et al. Not All Skepticism Is Equal: Exploring the Ideological Antecedents of Science Acceptance and Rejection. Personality and Social Psychology Bulletin 2018;44(3):384–405.
- National Academies of Sciences, Engineering, and Medicine. Examining the Mistrust of Science: Proceedings of a Workshop–in Brief. Washington, DC: The National Academies Press; 2017.
- For more on this, please see the discussion of the social contract in Chapter 1.
- National Science Board. Science and Engineering Indicators 2018, Chapter 7. Alexandria, VA: National Science Foundation; 2018. Also https://www.nsf.gov/statistics/2018/nsb20181/report/sections/science-and... [accessed 9 May 2019].
- As measured by the Gallup World Poll question, 'Is the economy in your city area getting better or getting worse?'
- Entradas M. Science and the public: The public understanding of science and its measurements. Portuguese Journal of Social Science 2015;14(1):71–85.
- Rasekoala, E. Science must evolve or risk being marginalised. https://www.scidev.net/global/technology/opinion/science-must-evolve-or-... [accessed 10 May 2019].Next Einstein Forum (2018, 24 August). New database puts African education research at the heart of policy and practice. https://nef.org/new-database-puts-african-education-research-at-the-hear...
- Mitchell R, et al. New database puts African education research at the heart of policy and practice. The Conversation 2018 22 August. https://theconversation.com/new-database-puts-african-education-research... [accessed 25 May 2019].
- Joubert, M. New policy commits South Africa’s scientists to public engagement.
Are they ready? The Conversation 2019 7 April. https://theconversation.com/new-policy-commits-south-africas-scientists-... [accessed 10 May 2019]. - Joubert, M. Science needs to start speaking to people’s everyday lives in Africa. http://theconversation.com/science-needs-to-start-speaking-to-peoples-ev.... [accessed 10 May 2019].
- Ciocca, D. Delgado, G. (2017) The reality of scientific research in Latin America; an insider’s perspective. Cell Stress & Chaperones. 2017;22(6):847–52. https://www.ncbi.nlm.nih.gov/pmc/articles/PMC5655372/.
- Pew Research Center. Religion in Latin America: Widespread Change in a Historically Catholic Region, Chapter 8. https://www.pewforum.org/2014/11/13/chapter-8-religion-and-science/. [accessed 10 May 2019].
- Pew Research Center. Americans, Politics and Science Issues. https://www.pewresearch.org/science/2015/07/01/americans-politics-and-sc...
- Science Media Centre Public attitudes to science and technology – key takeaways. https://www.sciencemediacentre.co.nz/2014/12/04/public-attitudes-to-scie...
- Ministry of Business, Innovation and Employment, New Zealand. Report on Public Attitudes Towards Science and Technology (2014). https://www.curiousminds.nz/assets/Uploads/report-on-public-attitudes-to... [accessed 10 May 2019].
- Department of Industry, Innovation and Science, Australia. The Australian Beliefs and Attitudes Towards Science Survey 2018. https://www.industry.gov.au/sites/g/files/net3906/f/2018-10/the_australi... [accessed 10 May 2019].
- Includes nominal majorities, i.e. countries where only between 51%–53% answered this question in the affirmative.
- UNESCO Institute for Statistics. http://uis.unesco.org/en/country/sa?theme=science-technology-and-innovation [accessed 10 May 2019]
- Alshayea A. Scientific Research in the Kingdom of Saudi Arabia: Potential for Excellence and Indicators of Underdevelopment. Higher Education Studies 2013;3(5). Also at https://files.eric.ed.gov/fulltext/EJ1079211.pdf [accessed 25 May 2019].
- UNESCO. UNESCO Science Report, Towards 2030: Executive Summary. Paris: UNESCO; 2015.
- OECD. Education at a Glance: OECD Indicators. http://gpseducation.oecd.org/Content/EAGCountryNotes/EAG2016_CN_SAU.pdf [accessed 10 May 2019].
- Ramos, YJ (2015). Science and Technology for Development in Bangladesh & Nepal: Key Topics, Challenges and Opportunities. SciDev.net Learning Series . https://www.scidev.net/filemanager/root/site_assets/docs/south-asian-rep... [accessed 10 May 2019]
- GSMA. Country Overview: Bangladesh. 2018. https://www.gsmaintelligence.com/research/?file=a163eddca009553979bcdfb8... [accessed 10 May 2019]
- International Monetary. World Economic Outlook, April 2019: Growth Slowdown, Precarious Recovery. IMF World Economic Reports. International Monetary Fund. https://www.imf.org/en/Publications/WEO/Issues/2019/03/28/world-economic... [accessed 10 May 2019]
- UNESCO. UNESCO Science Report, Towards 2030: Executive Summary. Paris: UNESCO; 2015.
- UNESCO Institute for Statistics. http://uis.unesco.org/apps/visualisations/research-and-development-spend... [accessed 10 May 2019].
- 111 countries included in the study also have available data regarding the level of gross domestic expenditures on research and development (R&D) expressed as a percentage of gross domestic product (GDP). Among these countries, the correlation between the percent of people who said science benefits 'most' people in the country and amount spent on R & D as a percentage of GDP was about 0.5.
- UNESCO (2015). UNESCO Science Report, Towards 2030: Executive Summary. Paris: UNESCO; 2015. Report notes Chinese spending on R&D now represents 20% of all R&D spending worldwide (closer to 10% earlier this decade) and 20% of all science-related publications are published in China (compared to 5% in 2010).
- European Commission. Eurobarometer 55.2: Europeans, Science and Technology. Brussels, Belgium: The European Opinion Research Group EEIG. 2001. http://ec.europa.eu/commfrontoffice/publicopinion/archives/ebs/ebs_154_e... [accessed 10 May 2019].
- UNESCO. UNESCO Science Report, Towards 2030: Executive Summary. Paris: UNESCO; 2015.
- Gambia Information Site. Min. of State for Higher Education, Research & Science. http://www.accessgambia.com/information/education-department.html [accessed 10 May 2019].
- Republic of Mauritius. Science, Technology and Innovation is the future, says Education Minister. Republic of Mauritius News May 10, 2018. http://www.govmu.org/English/News/Pages/Science,-Technology-and-Innovati... [accessed 10 May 2019].
- Note: while this analysis cannot be compared directly to past research, other studies have identified different types of attitudinal groups derived from survey results, such the Public Attitudes to Science 2008 report released by the Research Councils UK. In that study, cluster analysis was used to identify four groups that, in general, had similar profiles to those described above, including the Confident, Sceptical Enthusiasts, the Less Confident and the Distrustful.
- See above for discussion for further context about these countries’ opinions towards the benefits of science.
- South America’s score on the Gallup World Poll Confidence in Institutions Index is 36 (out of 100), the lowest of the 19 regions. The second-lowest score was Central America and Mexico, at 41.
- As measured by the Gallup World Poll Confidence in National Institutions Index. Correlation between % of country who are Strong Sceptics and country’s Index score is 0.609.
- Rule J. Labour in a Changing Economy, 1700–1850. ReFRESH (Economic History Society) Spring 1991. http://www.ehs.org.uk/dotAsset/a9ce710d-3b24-406c-9652-07bf43657f86.pdf [accessed 10 May 2019].
- World Economic Forum. https://www.weforum.org/focus/fourth-industrial-revolution [accessed 10 May 2019].
- Nedelkoska L, Quintini G. Automation, skills use and training. OECD Social, Employment and Migration Working Papers No.202. Paris: OECD Publishing, Paris; 2018. Also https://www.oecd-ilibrary.org/employment/automation-skills-use-and-train... [accessed 10 May 2019].
- European Commission Eurobarometer Qualitative Study (2015). Public Opinion on Future Innovations, Science and Technology. http://ec.europa.eu/commfrontoffice/publicopinion/archives/quali/ql_futu... [accessed 10 May 2019]
- Dennett D, Plantinga A. Science and Religion – Are They Compatible? Oxford: OUP; 2011. Also https://plato.stanford.edu/entries/religion-science/ [accessed 26 May 2019].
- Pew Research Center. The Social and Legal Dimensions of the Evolution Debate in the U.S. 2009 4 Feb. https://www.pewforum.org/2009/02/04/the-social-and-legal-dimensions-of-t... [accessed 10 May 2019].
